Scientists, especially in biological and statistical work with 'populations' continually find and make use of the 'Bell Curve'.
The Bell Curve is a typical pattern of population distribution, so typical in fact, that equations are used to plot it, and parameters are tweaked to align its contours with given data, fill out and predict unknowns, and predict expectations for future research.
By 'population', we mean any group of independent objects, like people, animals, items, measurements, or even more abstract things like 'instances', 'examples', 'cases', elements, or anything that can be separated and distinguished as individuals, forming a group. Bell curves are as frequent with abstractions as they are with physical objects. The scales, parameters, coordinates can also be just about anything, and Bell-like curves will appear.
Almost any such group will exhibit some kind of 'Bell Curve' shape when plotted on a graph. This strange coincidence is actually based on well-understood probability factors. Simply put, there are more opportunities and chances for an individual to be somewhere in the middle of the scale than at the extremes. Its easy to be average or mediocre.
Above, we will find that there are few really great copyists (near-perfect), and equally few really bad ones (they would be replaced). We might find very few copyists making 30 or more errors per page, and equally few making 1 or less per page, while most copyists might score in the 5 or 10 errors per page range.
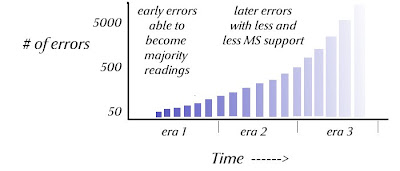
If we are simply observing raw error rates, these will be rather constant, with minor variations in certain times and places, depending upon training or copying methods. This is important, for errors can be plotted over time. If we imagine the copying stream as an ever-expanding fan, we may notice that the average density of errors will be rather constant, while the number of errors in each time-zone goes up, not only the total error-count:
We can modify this view to make it even more realistic, by allowing that early copyists produced more errors (i.e., a lower skill base), but this will be more than offset by the actual exponential (fibbonaci-like) growth of the manuscript count:
From this we can see that it will remain true that most raw errors will happen later in time, and not be early errors. Why does this seem to contradict the recent acknowledgement by textual critics that in fact "most errors are early"?
The reason is that most errors are actually ignored, and critics only focus on a small subset of the actual errors found in the manuscripts. For instance, most 'singular errors' (occuring in only once) are not even noticed or recorded. Only readings that have an added 'life-line' (by being copied), or have support (they may have spread by coincidence or mixture) are generally discussed. But this is not proper sampling, and gives a misleading picture of the history and spread of errors.
Now we enter into the most remarkable and subtle part of the analysis. This will require the reader's careful attention and insight.
Those who advocate for the 'early readings' (Alexandrian) as a group as against the 'later' Majority readings (Byzantine) would say "Aha! Most errors are late, and so the probability is therefore that most Byzantine readings are late, vindicating the antiquity of the Alexandrian text-type."
That conclusion however is a demonstrably false analysis:
(1) The majority of errors are not majority readings. These are two completely different groups of variants. The majority of errors are in fact minority readings, and must be, by the nature of the case. Most will have occurred very late in the copying stream, and cannot have had any opportunity whatsoever to become majority readings. The true distribution of raw errors will indeed resemble the lopsided 'bell curve' below:
 |
| click to enlarge |
Perhaps even more importantly, the early errors represented here, may indeed be themselves majority readings, but they will not be the majority of majority readings. They will be a small subset of the total number of majority readings. Most majority readings will not be errors, but rather will represent the correct text.
Furthermore, the small subset of early majority readings represented above, which may indeed be errors, will be clustered, each associated with some severe anomaly that caused them to become majority readings. The competing clusters of variants (correct readings), especially those coming earlier in this one singular source (the archtype of the Byzantine transmission stream) will necessarily have been purged from all other copying streams.
The basic Byzantine text-type can be seen to have been in existence since the 5th century. If that is so, then its unique "Majority" readings (whether errors or not) must have originated much earlier than this, to become dominant from this time onward, both in the Greek and Latin copying streams.
 |
| Click to Enlarge |
The Majority readings of the Byzantine text, and the majority of errors (which again are found mostly in the Byzantine texts) are two completely different sets of variants (entities).
Contrary to uncritical expectations, the nature of the error-producing process and the spread of errors over time, prevent the bulk of errors from becoming majority readings, whether they are copied or not by future copyists.
- The Engineer


No comments:
Post a Comment